0
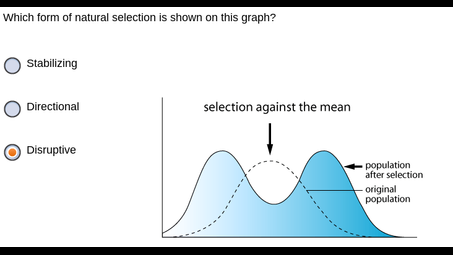
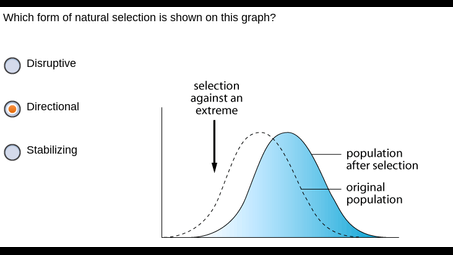
Which form of natural selection is shown on this graph comprehensive bio?
Wiki User
∙ 7y agoDisruptive
monique robles
Mary
Add your answer:
Why was variation the weakest concept in Darwin's theory?
Variation?!?! That was an obvious observation of naturalists that opposed Darwin's concepts totally. Unless you mean the heritability that leads to variation? Explaining that variation was the problem. Creationists of the time explained this by positing god's whimsy in designing his species, but this was shown to be nonsense as natural processes are at work in variation and this can be shown experimentally. The concept of natural selection explained how that natural variation was selected on beneficial traits. What Darwin did not understand is how that variation was passed on to progeny. His explanation was wrong.
What are some of the different theories of evolution?
There is only one central "theory of evolution", which is the theory of evolution by natural selection that Charles Darwin pioneered. There have been different theories in the past - such as Jean-baptise Lamarck's theory of acquired traits - but these lost their status of scientific theory when they were shown to be wrong.
What are three myths about evolution through natural selection?
Answer: Many, even the majority, who follow Darwinian evolution by natural selection would not agree that there are any myths connected with it. That said, real science, with solid evidence to back it up would produce a number of possible answers to this question: 1. Natural selection does not explain the adding of new genetic information into the genome of organisms that enable the changes that evolution believes happen such as the change from dinosaurs into birds. this has never been demonstrated scientifically. Famous evolutionist Richard Dawkins was asked about this issue some years ago and had no answer, no example of an information adding mutation. So this is one 'natural selection myth.' 2. Another seeming "myth" -Natural selection culls out the sick and the weak -the work done by predators. In fact scientific studies on the 'chase-kill response' in predators shows they prefer to attack healthy individuals. We are here talking about predators such as lions, tigers, cheetahs etc. and their prey. This may be that they are attracted to a chase which is not provided by a sick or weak prey and they may also be wary of disease in weak individuals, which also may not provide a good lot of meat they are after. 3. Another myth (assuming we are talking about the modern evolutionary synthesis which includes mutations) is that mutations actually provide new information -they in fact are shown in modern studies to be degrading the genome. this is particularly shown to be so in humans -probably the most studied of the 'higher organisms". Human geneticists are agreed that the human genome is degrading not getting better, through mutations. This is because by far the majority of mutations are of small effect and so are not 'noticed' by natural selection. This effectively means the human genome is deteriorating like rust accumulates on a car over time.
What evidence is used to refute theory of evolution?
There is no evidence that refutes the theory of evolution by natural selection. Critiques and arguments by creationist and ID advocates are always poorly thought out and easily shown to be wrong by even undergraduates. The arguments use straw men and other fallacies plus they have been refuted so many times that to bring one of these arguments up is to self parody.
What is correct Had showed or had shown?
had shown
What process produced the two different types of beaks shown?
natural selection
What type of graph is shown?
pie graph
Information in a circle graph is often shown as?
Information in a circle graph is often shown as percentages.
How does a graph showing speed differ from a graph showing acceleration?
Speed can be shown on a graph of position versus time, and acceleration can be shown on a graph of speed versus time.
What does the equillibrium point on a supply and demand graph represent?
which is true about the functional relationship shown in the graph
What variables are shows on the graph?
Any variables can be shown on a graph.
What is the axis of symmetry of the function shown in the graph?
I regret that I can see no function shown.
Once a graph has been created would y?
Once a graph has been created, y would be the axis which is shown up and down on the graph. The x axis is shown from left to right on the graph. Both are reference lines on a graph.
What conclusion can be drew from the information on the graph?
What conclusion can be reached by the data shown on the graph?
In the book The Origin of Species does evolution occur by means of natural selection?
Yes, that is what Darwin thought. However this has never been shown to be true.
How is constant speed shown on a graph?
Constant speed is shown on a graph using straight lines. The straight line indicates that there are no fluctuations with the speed.
How many products can be shown on a single production possibilities graph?
Only two products can be shown on a single production possibilities graph