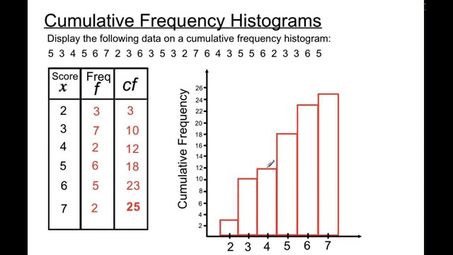
A) histogram
B) scatter plot
C) time series plot
D) contingency table
The Answer is "A" it's a Histogram
A bar chart is a graphical representation of data. A frequency table is a table of numbers, which breaks numbers into various groups, based on how often values occurs within ranges.
Curtis Strite

Curtis Strite
Add your answer:
Why is the frequency spectrum of a discrete signal repetitions of the spectrum of the analog signal?
The analog signal is converted to discrete signal. Even after the conversion, the frequency of the actual signal still remains the same. If the frequency of the discrete signal is different from the analog signal, the reconstructed signal would be different again. This is not what we expect. So base spectrum for similar signals have same frequencies, whether they are discrete or analog. Why do the repetitions occur? The original analog signal is multiplied with a dirac pattern. The base frequency is then shifted to the places, where diracs are available. So long the diracs keep repeating, the base frequency do repeats. Hope you are convinced with my answer
What is the data of the weather vane and is it analog or digital?
Analogue
When analog voice signal converts into digital signal the bandwidth needs 64kbps. Why?
PCM technique is used to convert analog voice signals into digital. In PCM the analog frequency is first sampled and then converted into binary bits. Each samples are taken as 8bits long. Basic communication theory requires that a minimum sampling rate of twice the frequency of the signal to be sampled will result in an accurate representation of the original signal.Human voice can have max 4000hz frequency, therefore sampling rate should be 8000 samples/sec.Which implies required bit rate for transmitting voice is 8000*8 = 64000 bits/sec = 64kbps.
What are the differences between analog and RF circuits?
analog circuit is circuit that generates audio, sound, radio etc (waves of the natural world) RF stand for radio frequency, it is often refer to the property of signal transmission in high frequency (HF). If you say a circuit is RF, the circuit would be in the frequency range between 3kHz to 300GHz. The reason that RF circuit is special is because the performance of signals of higher frequency is different to other lower frequency AC circuits. When designing a RF circuit, RF engineers have to consider the type of wires, lengths, use of components, signal loss etc. It is because high frequency signals would take a piece of wire (longer than 1/10 of signal wavelength) as wires with many inductors and capacitors.
What is analog time?
I thank that antalog time is the time on a analog clock, It makes since analog time on a analog clock.
What is the difference between a bar chart and a frequency table?
A bar chart is a graphical representation of data. A frequency table is a table of numbers, which breaks numbers into various groups, based on how often values occurs within ranges.
What is the IS function?
function generator generates different types of functions to cro. And it can send analog signals to cro to create their graphical representation, and by it we can vary frequency and amplitude of the given wave function
What is the function of the?
function generator generates different types of functions to cro. And it can send analog signals to cro to create their graphical representation, and by it we can vary frequency and amplitude of the given wave function
What is function of the function?
function generator generates different types of functions to cro. And it can send analog signals to cro to create their graphical representation, and by it we can vary frequency and amplitude of the given wave function
What are frequency Polygon?
Frequency polygons are graphical devices used for understanding the shapes of distribution.
What is a graphical representation of a table?
A chart.
What goes after frequency in a frequency table?
the table
In which Analog to analog modulation methods does the peak amplitude?
Frequency modulation Phase modulation
Is data is transmitted in the form of digital or analog?
both but for analog usually a frequency Carrier is required
Parts of the Frequency Table - 37k?
parts of frequency table
How do you complete the frequency table?
First, you need a frequency table.
What are the General rules of constructing Frequency table?
General rules of constructing Frequency table General rules of constructing Frequency table
